
Author: Carlos Salas Najera
The article will cover a brief piece of proprietary research exploring a relatively new machine learning approach to enhance portfolio optimisation problems: the TIC (Theory-Implied Correlation) matrix approach. A brief introduction about this method was written in a previous article ‘Embracing machine learning to tackle portfolio optimisers limitations’. This article will expand on that introduction, providing some more details about the theory specifics behind TIC, along with a simple illustration with small data of its potential when applied to portfolio management.
Beyond MVO Optimisation: Machine Learning to the Rescue.
Portfolio optimisation has been one of the many areas in the investments industry benefitting from Machine Learning breakthroughs. Tan (2012) provides an illustration of this fact using an unsupervised Machine Learning algorithm like PCA (Principal Component Analysis) to enhance the robustness of the estimated covariance matrix used in portfolio optimisation algorithms such as MVO (Mean-Variance-Optimization) while reducing transaction costs. An alternative approach is the use of shrinkage factors to filter out noise from the historical covariance matrix of returns, which also resulted in superior performance compared to naïve approaches (e.g. equally-weighting portfolio), and most importantly, improvements in terms of model robustness i.e. weights stability gains over time.
Shrinkage was one of the mostly accepted solutions by practitioners over the last decade, yet shrinkage methods are prone to suffer from a clear trade-off between noise and signal. In other words, shrinkage methods can trim down noise from covariance matrix estimates but at the expense of weakening as well valuable investment signals. Multiple authors have pointed out that the shrinking process does not discriminate between eigenvectors associated with noise and eigenvectors associated with signal.
Alternative Machine Learning methods such as Lasso, Ridge or Elastic Net regularisation have also been applied to the problem of enhancing the estimate of the covariance matrix of security returns with similar results as shrinkage methods, which is basically a flat behaviour of the noise-to-signal ratio. Fortunately, advances in unsupervised machine learning precipitated the advent of a new approach: Hierarchical Risk Parity models.
Hierarchical Risk Parity Models: Enhancing Robustness.
Hierarchical Risk Parity (HRP) models use intensively graph theory and machine learning to build a hierarchical structure of the investment universe that allows a more efficient allocation of securities into clusters with similar characteristics without relying on backward-looking classical correlation analysis. Mathematically speaking, HRP models are based on defining a distance metric that is applied to single-linkage clustering to identify hierarchical relationships. These relationships are later used to transform the empirical covariance matrix. Clustered securities are ingested by a recursive bisectional search that applies a top-down inverse-variance weighting reducing the number of degrees of freedom.
Multiple authors such as Lohre, Rother, and Schafer (2020) and Lopez de Prado (2019) have proposed multiple iterations of HRP models seeking to challenge the perfect network assumption embedded into traditional covariance matrix estimation methods such as using the empirical approach based exclusively on the historical relationship of returns across many different securities, assets, and factors.
Lopez de Prado (2019) proposes a Theory-Implied Correlation (TIC) matrix approach to address the backward-looking bias of using the earlier mentioned empirical approach to estimate the covariance matrix of security returns. In this way, TIC fits a tree graph structure to an empirical correlation matrix by deploying hierarchical clustering and offers the possibility to investors to factor qualitative information about the securities of the portfolio. Some examples of this information are the membership of these securities to a specific industry, their structural economic cycle sensitivity, meaningful supply chain relationships, or the exposure to a specific thematic megatrend or macro event (e.g. Covid19); among many others.
A good real case example of qualitative information turning into insights is the Brexit geopolitical event. In this way, UK stocks experienced during, and after, the Brexit vote a clear duality in terms of performance regardless of their exposure to traditional premia factors such as size, style or quality. This behaviour was driven by the emergence of a brand-new factor kicking into valuations: the Brexit risk premium. The referendum outcome resulted into the pricing of a new piece of qualitative information i.e. a significant discount was experienced by those stocks with exposure to EU trade; whilst a hefty premium or lesser discount was felt by those British firms more insulated from this political event.
In this way, TIC could have been a good approach to incorporate this new qualitative information into the portfolio optimisation process using either a fundamental approach whereby in-house investment analysts are able to identify those stocks with significant Brexit exposure, or the output from a systematically-driven quantitative analysis of the geographic exposure per stock.
A Simple Example: Walking the Shoes of an ETF Provider.
From an ETF provider standpoint, the challenge is not about outperforming the benchmark but to mimic it as closely as possible. In other words, this problem could be expressed mathematically as the minimisation of a measure such as Tracking Error.
For the sake of simplicity and due to data availability constraints, the problem will be solved by restricting the dataset to the period July 2018 to June 2019 with the period July 2018 to March 2019 selected as training period. This will allow us to deal more easily with data integrity issues related to the lack of freely available information about index membership.
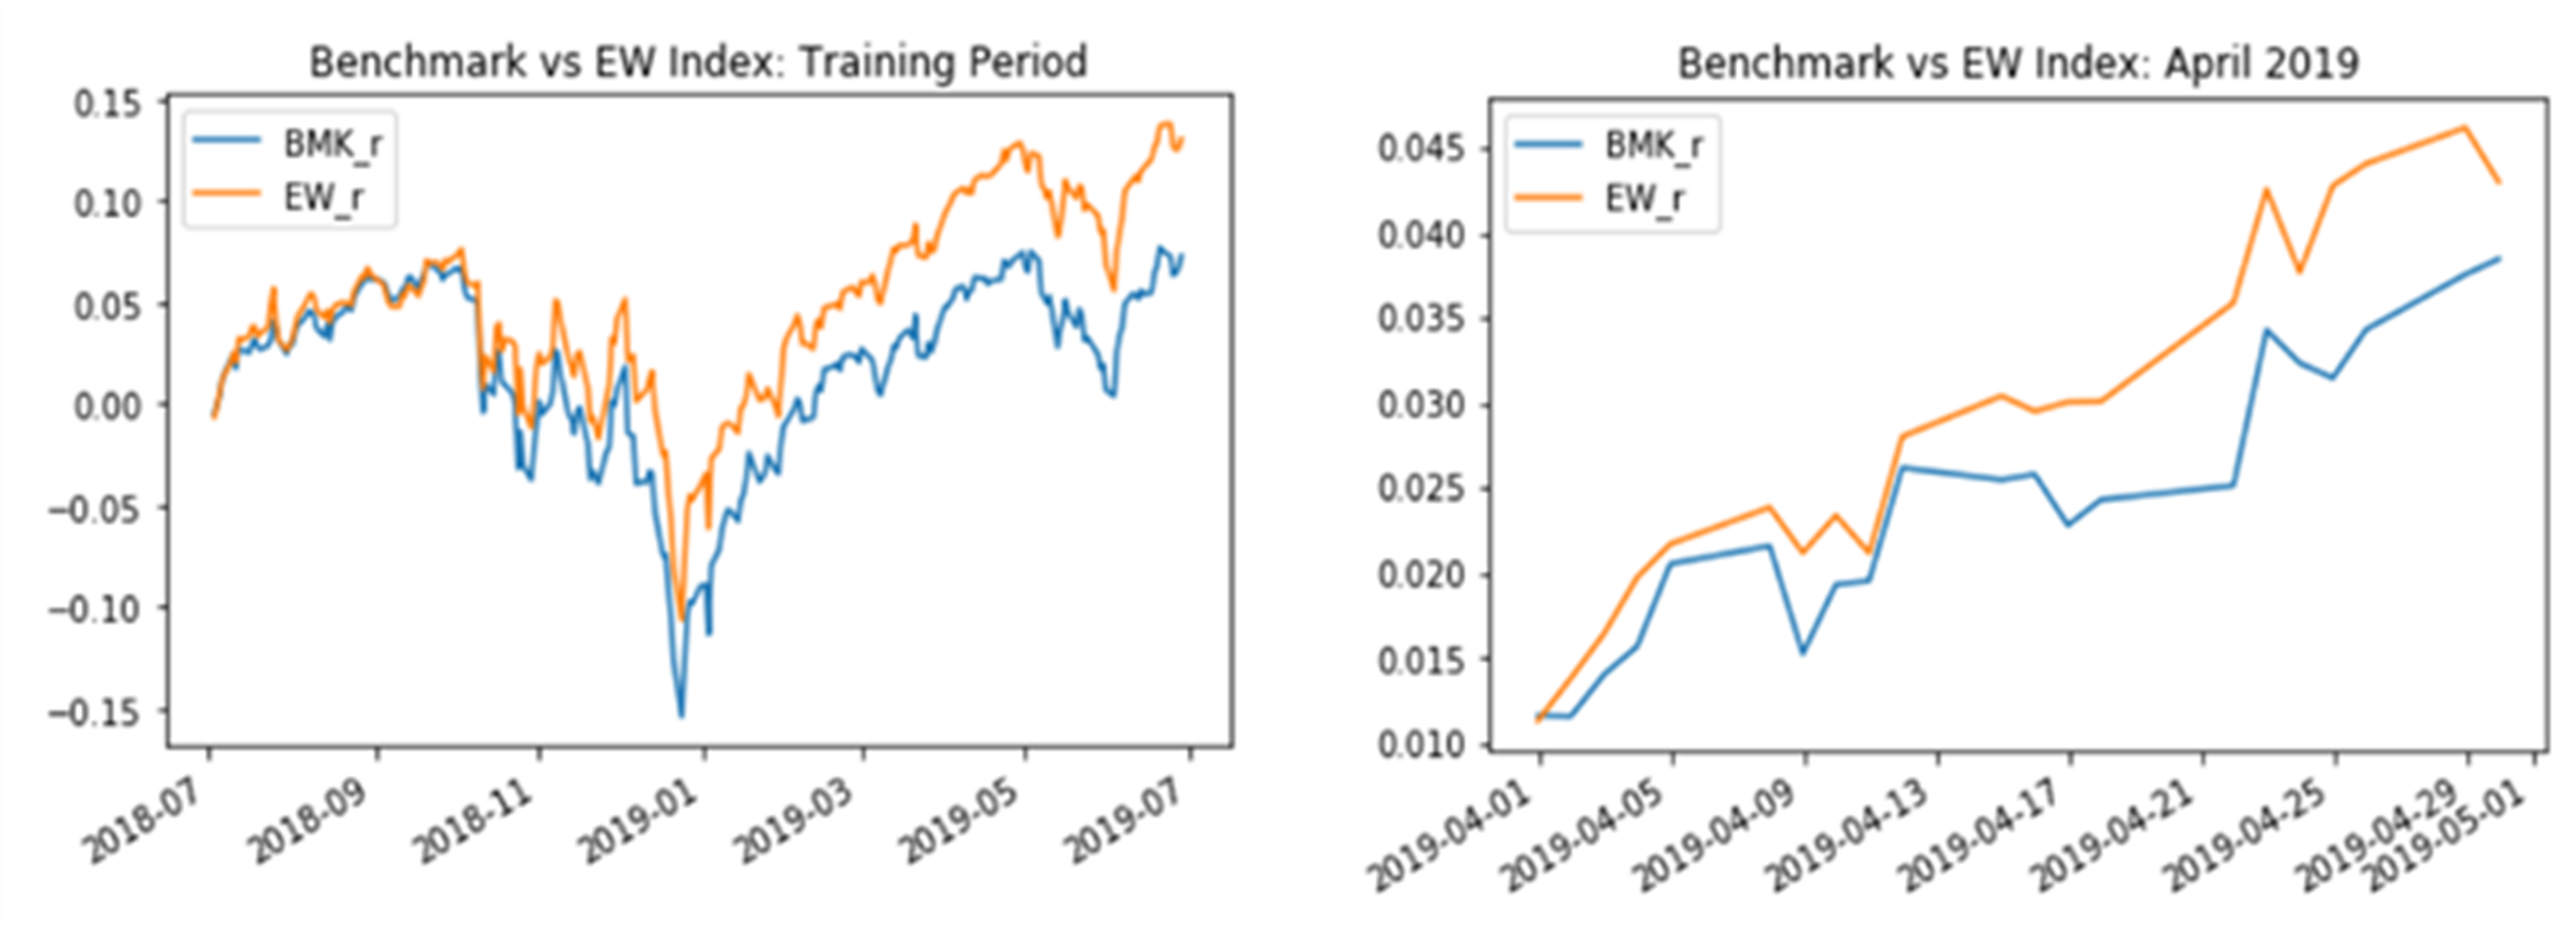
Firstly, a simple equally weighted (EW index) naive strategy is calculated for the top 25 stocks. The chart below shows how this EW strategy significantly outperforms the benchmark (Russell 1000 Index) during two periods. This EW index and the benchmark will play an important part as yardsticks when proposing new methods to solve our problem: minimising the tracking error of our concentrated portfolio against the Russell 1000 index.
Minimising Tracking Error Using the Empirical Approach.
This first method uses a traditional portfolio optimisation method based uniquely on a numerically empirical approach i.e. historical stock returns observations. The empirical approach is implemented to construct a strategy using exclusively training period data based on obtaining the matrix form of the tracking error function, which will be minimised to calculate the optimal security weights based on a constrained optimisation with three key constraints:
- The portfolio weights must sum up to 100%.
- Shorting is not allowed.
- The individual optimal weights per security must be at least 1% but no more than 5%.
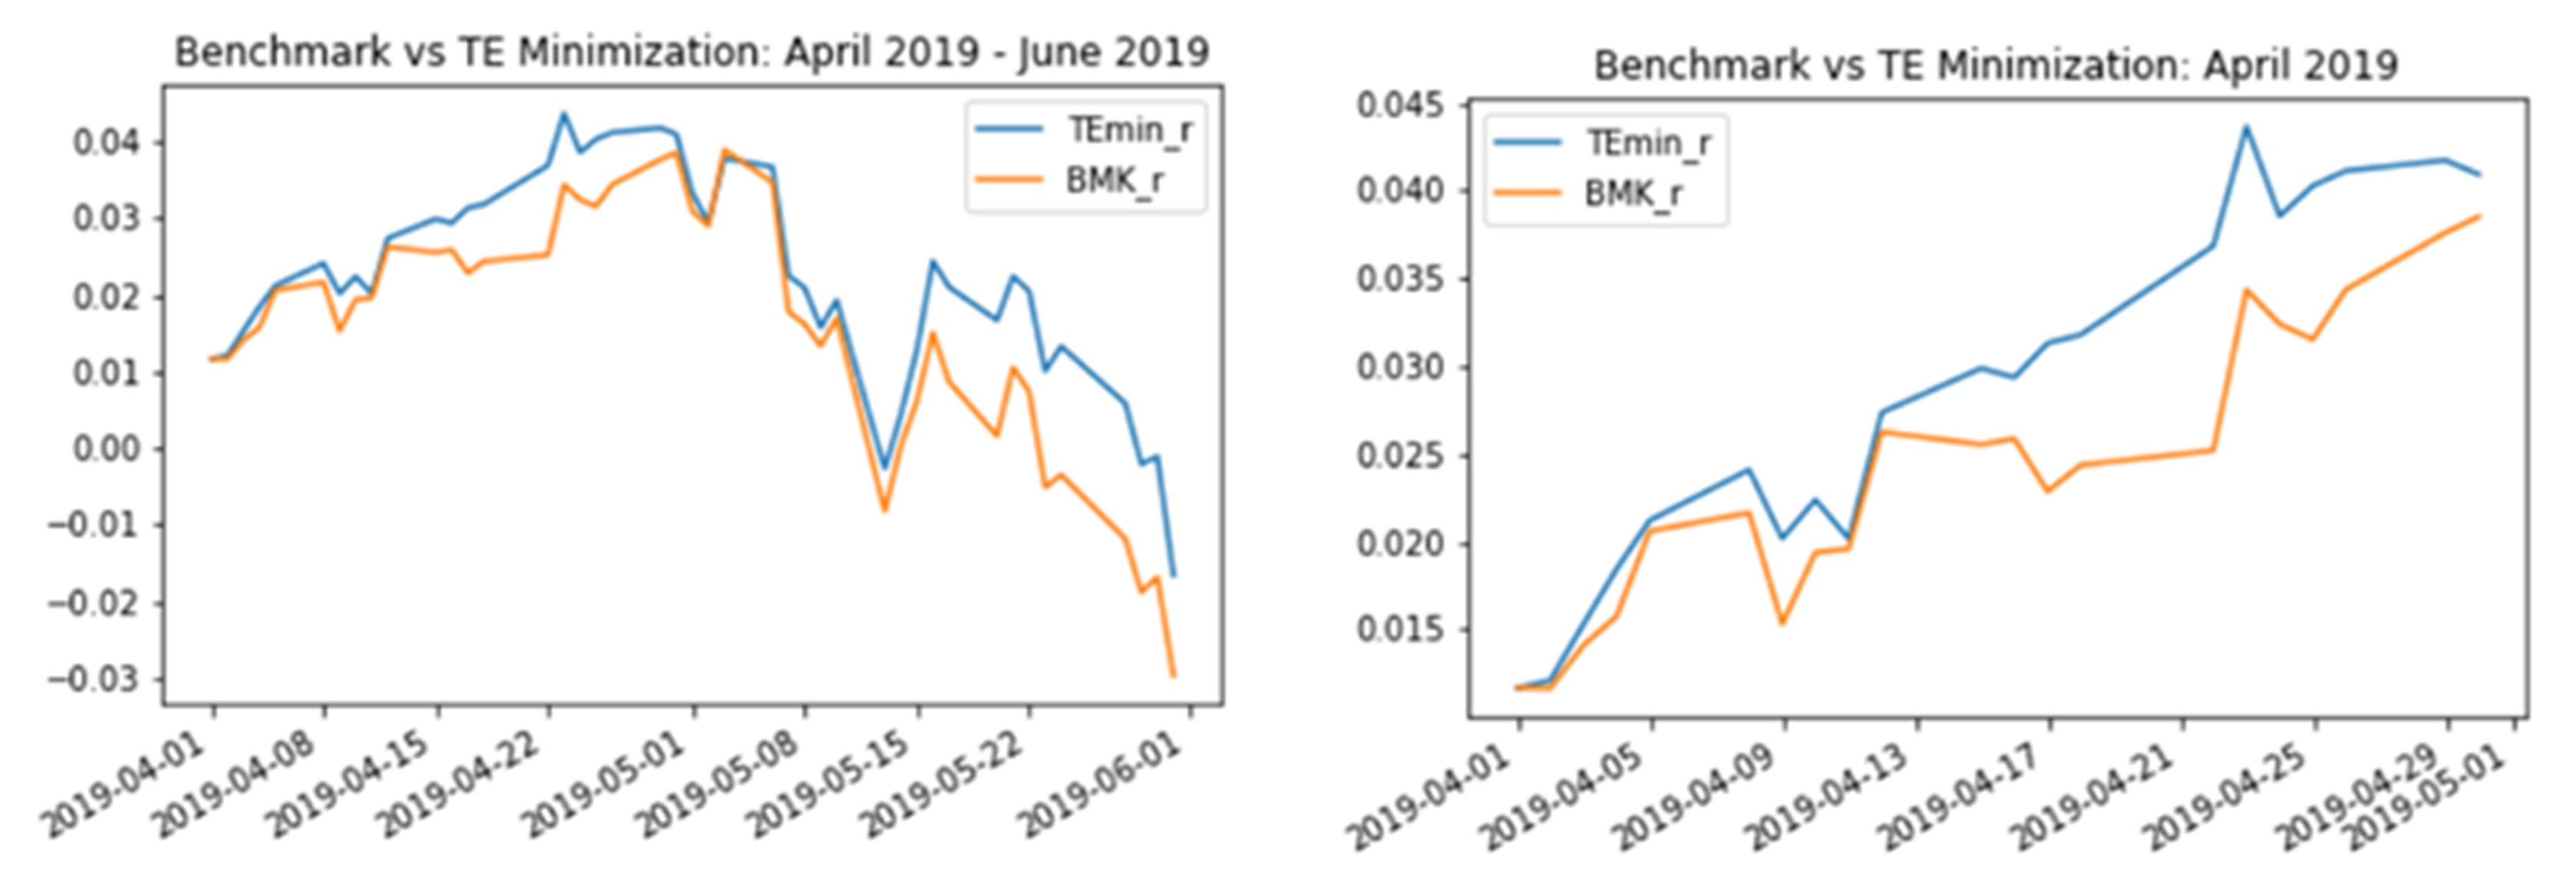
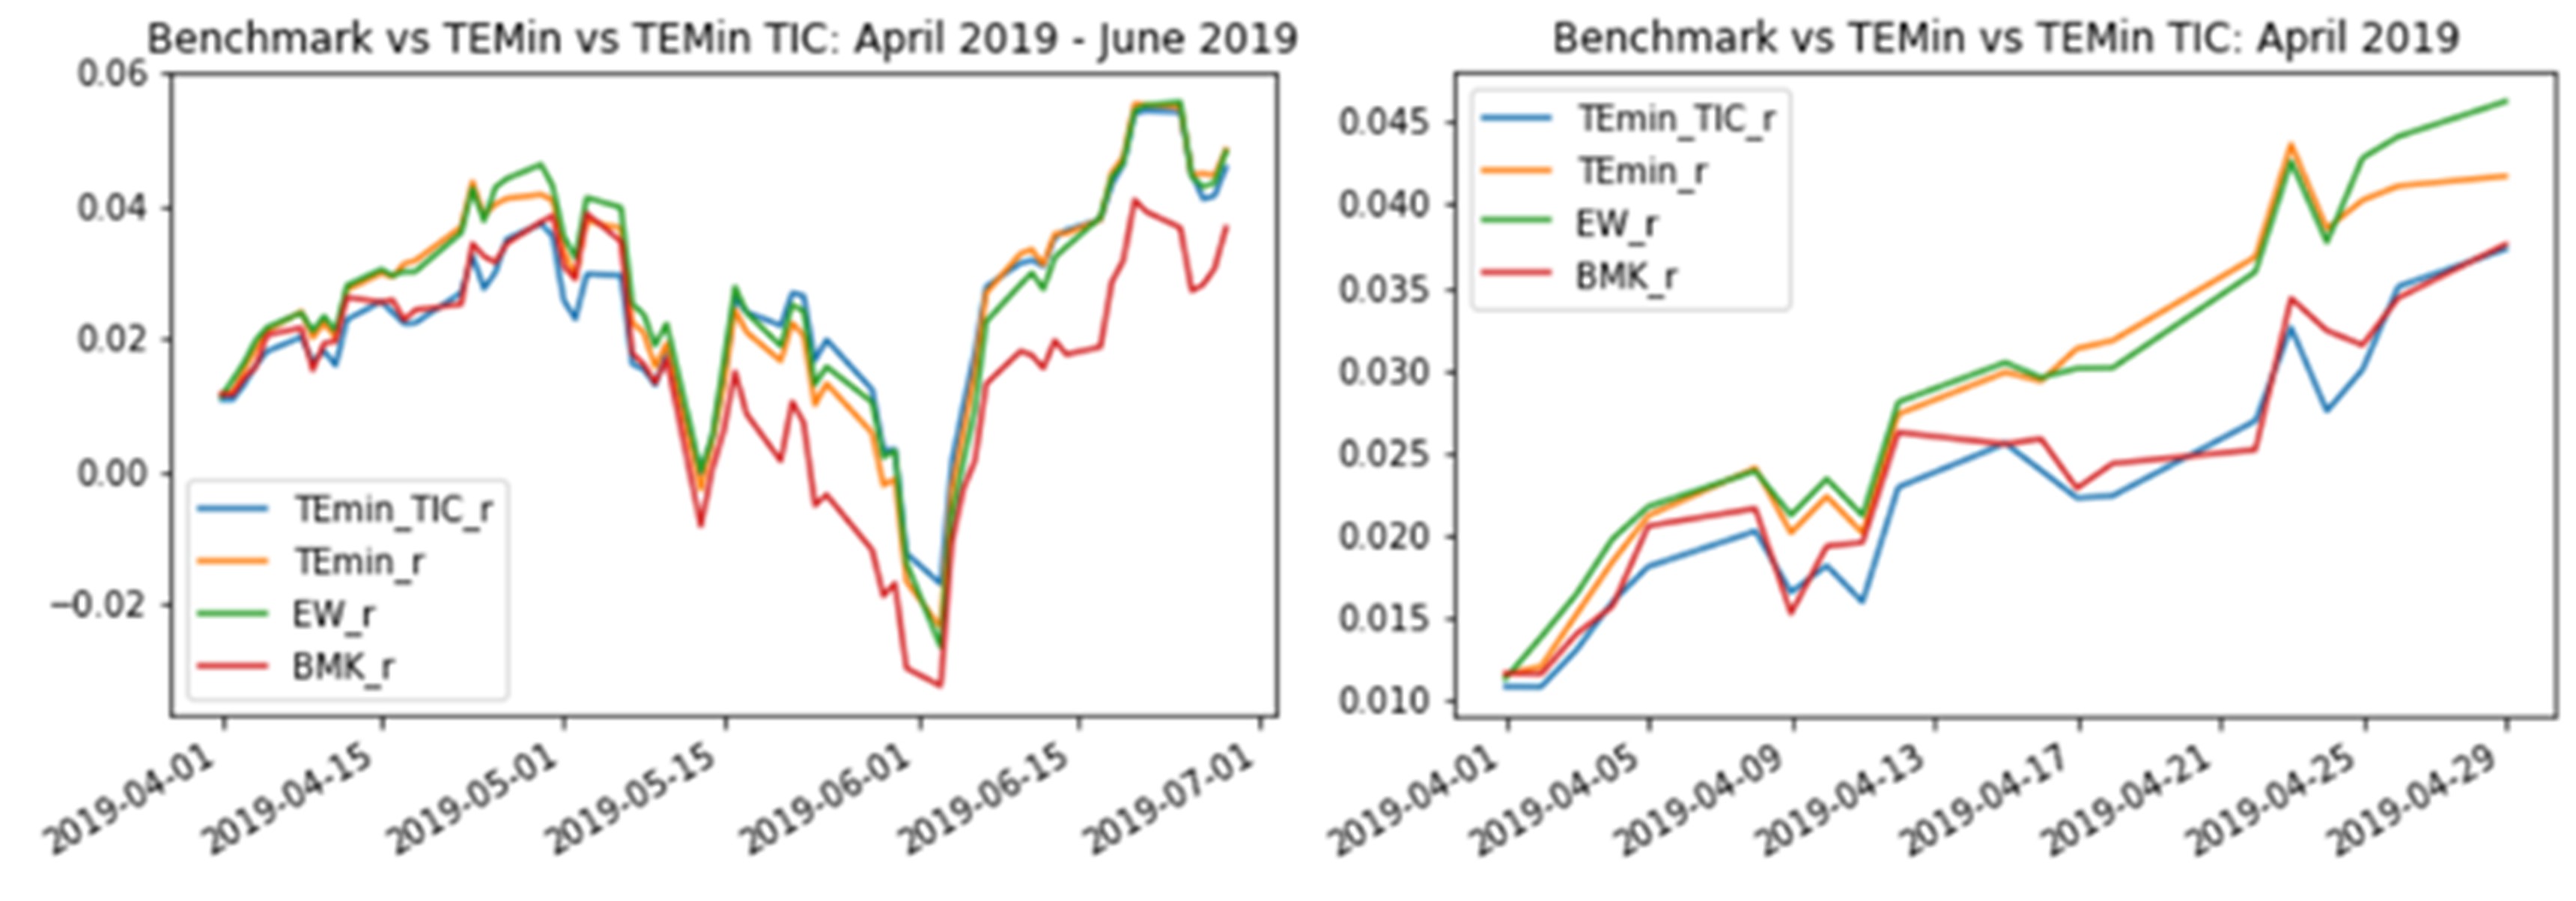
The next charts display a comparison of cumulative returns from investing in the empirical approach (TEmin_r) and a buy-and-hold strategy (BMK_r) with the former approach outperforming the benchmark. That said, it is worth remembering this is not the objective of the exercise since the ETF provider only seeks to minimise basis risk i.e. mimic closely the benchmark without outperforming or underperforming significantly in order to provider a reliable instrument to mimic Russell 1000 with only 25 stocks.
Enhancing the Empirical Approach: TIC in Action.
As explained earlier, the previous empirical method is regrettably based on historical correlation matrices. As presented in the first part of this article, the empirical approach has been tagged by several authors as suffering from a lack of stability and robustness. Moreover, this approach is not reliable and inherently introduces a dubious perfect network assumption on security interplay, while displaying a well-documented weakness in terms of predictive power, as showcased by the Tracking Error decay in the last section.
Fortunately, recent quantitative research has delivered significant progress in this area: enter TIC, which deploys a Machine Learning (ML) algorithm to estimate forward-looking correlation matrices implied by economic theory or other qualitative relationships. Therefore, given a particular theoretical representation of the hierarchical structure that predominates within a set or universe of securities, the method fits the correlation matrix that complies with that theoretical representation of the future and uses the historical “empirical” correlation matrix to create a brand new “enhanced” matrix.
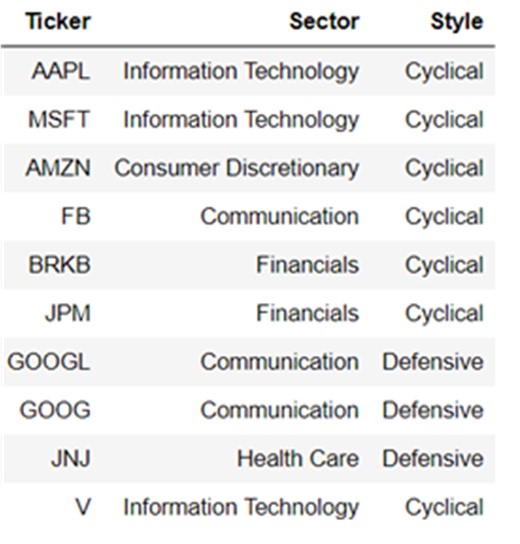
As explained in previous sections, different theories can be used to estimate different TIC matrices such as supply-chain relationships theory or thematic event-driven exposures. For this particular example, we are playing the role of an ETF provider that possesses a proprietary stock universe mapping tool that allows to use a tree graph which incorporates “GICS Sector” classification information and an in-house metric of cyclicality (Cyclical or Defensive) as shown below for the top ten securities by market capitalisation for our total 25-stock portfolio:
Putting Everything Together.
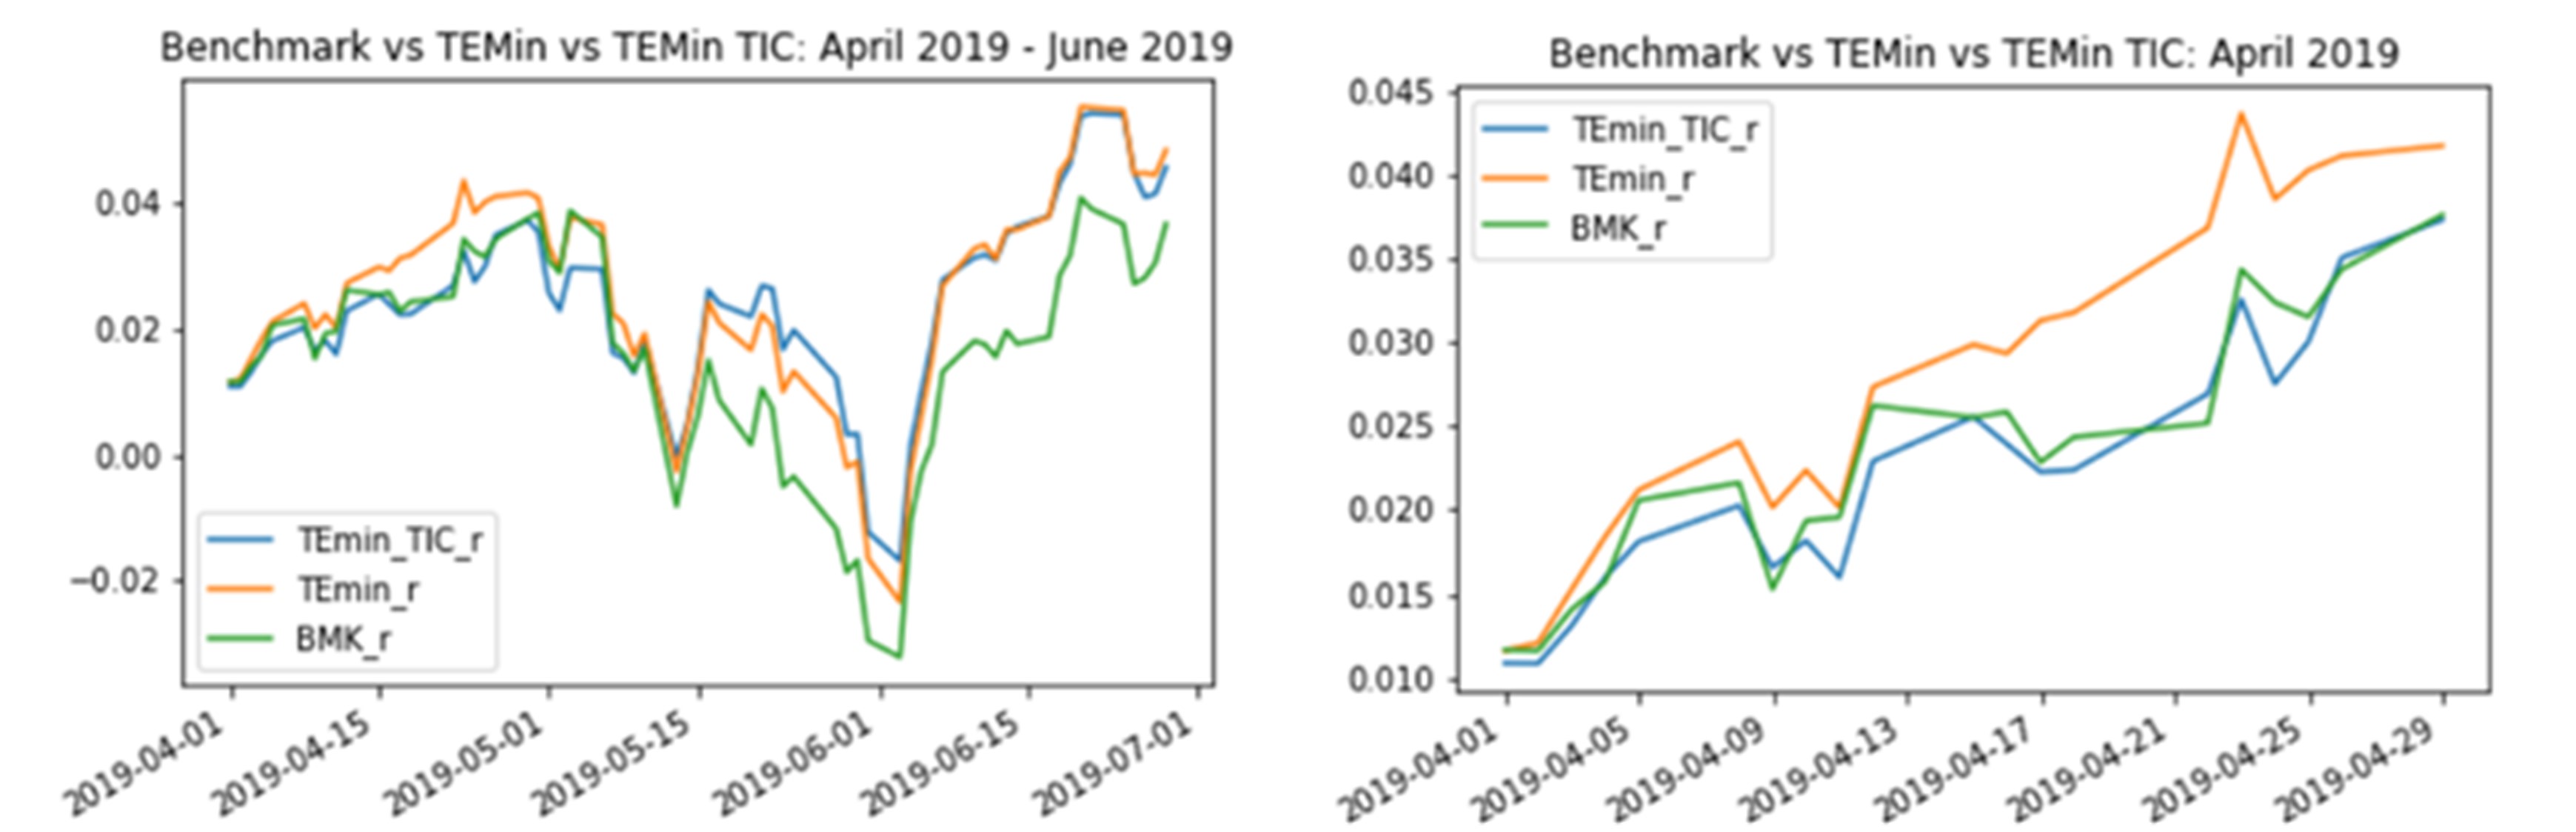
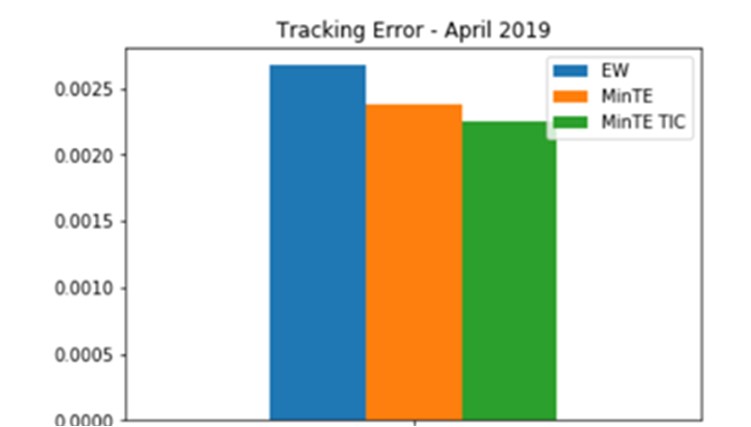
The illustration below shows how the TIC approach is able to improve both our naive equally-weighted index (EW) and the first optimisation method based exclusively on historical correlations i.e. empirical approach. That said, it seems TIC might require a more frequent recalibration to work beyond one-month forward periods after training and refrain from suffering episodes of tracking error decay.
Although this simple example has used a very limited amount of data, and a short period of time for training and testing, the results of the analysis are in line with the claims of multiple scholar and practitioners’ research: TIC seems to add value within a portfolio optimisation process. The principal appeal of TIC is the possibility to incorporate qualitative insights, based on a fundamental sound rationale, into a quantitative portfolio optimisation problem. Even the introduction of simple and well-known theories such as “GICS Sector Classification” or “Sector-Cyclicality”, which are easily obtainable from conventional data, have proven to add value in the TIC optimisation process.
Conclusions
Although the example presented in this article has been focused on minimising Tracking Error from the standpoint of an ETF provider concerned about synthetically replicating a liquid index, the TIC approach could also be integrated by active investment managers seeking a different objective such as limiting the amount of risk of their mandates, or increasing their reward per unit of risk. This article was meant to offer a hands-on example about the utility of TIC, yet for those readers interested on a deep dive including TIC mathematical concepts and coding details, I vehemently recommend them to read the references included in the bibliography of this article.
Bibliography:
- Tan, J. (2012). Principal Component Analysis and Portfolio Optimization. Pacific Life Insurance Company.
- Menchero, J., Wang, J., Orr, D.J. (2018). Improving Risk Forecasts for Optimized Portfolios. Financial Analysts Journal V.68, 2012, Issue 3.
- Lopez de Prado, M (2019). Estimation of Theory-Implied Correlation Matrices. Cornell University - Operations Research & Industrial Engineering; True Positive Technologies.
- Lohre,H., Rother,C. , Schafer, K.A, (2020). Hierarchical Risk Parity: Accounting for Tail Dependencies in Multi-Asset Multi-Factor Allocations. Chapter 9 in: Machine Learning and Asset Management, Emmanuel Jurczenko (ed.), Iste and Wiley, 2020, pp. 332-368.
- Pedersen, L.H., Babu, A., Levine, A. (2021). Enhanced Portfolio Optimization. Financial Analysts Journal. V. 77.