
Author: Carlos Salas Najera
Carlos Salas Najera, University of London, Lead of the CFA UK Data Science Working Group, discusses a series of articles called "Man+Machine", which provides guidance on how to bridge the gap between fundamental analysis knowledge and new data science, machine learnining and AI methods.
This first article will provide an overview of the historical evolution of systematic fundamental scoring models, and an introductory analysis of how Machine Learning (ML) is transforming and enhance these traditional indicators. This article is designed to briefly introduce readers without prior knowledge of fundamental scoring models.
Fundamental scoring models: The Pre-ML Era.
Fundamental scoring models were introduced as a systematic way of applying fundamental analysis to detect more efficiently bankruptcy situations, identify fraudulent companies or simply shortlist bad accounting situations.
At the beginning: Altman’s Z-Score
The second half of the 20th century brought new methodologies to systematically identify bad accounting in the books of companies. The pioneers in this field were William H. Beaver and Edward Altman with the latter using the former body of research as inspiration to create his well-known Z-Score in 1968. Altman’s Z-Score was praised at the time for a significant level of accuracy of 94% in predicting company bankruptcy one year before the event, and a low single-digit misclassification error (Type II). New iterations of this score using recent data and new added components have also provided reasonable levels of accuracy well above 80% even for out-of-sample experiments (Altman 2000).
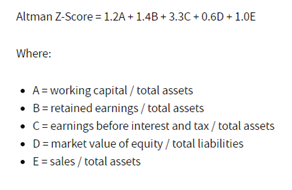
Source: Altman 1968. Author Formatting.
Among the many weaknesses of Altman’s Z-Score model are dependent variable dichotomy, sampling method, lack of stationarity, feature selection bias, geographic and sector-dependency bias, and a faulty understanding of the ML problem.
These weaknesses will be covered more thoroughly in a future article exclusively focused on Altman’s Z-Score model, yet the sampling bias and the faulty understanding of the ML approach is worthy of further investigation. In this way, Altman uses a training sample with the same number of bankrupt and non-bankrupt companies and, as a result, his research suffers from sampling method bias as empirical evidence has showed that bankruptcy cases across many developed economies are approximately well below the low-single-digit as percentage of the total companies in the economy. Ideally, the researcher should always work with a training set that contains a faithful representation of the distribution of the class to be studied.
In this way, when the number of samples in the training dataset for each class label is not balanced - many more non-bankrupt than bankrupt companies - the researcher needs to understand that is facing an imbalanced classification problem i.e. the distribution of examples across the classes is not equal. Max Khun defines very well this problem in his book “Applied Predictive Modelling”: “An imbalance occurs when one or more classes have very low proportions in the training data as compared to the other classes”.
Although Altman’s Z-Score initial purpose was to identify bankruptcy cases, other researchers have found that this scoring model can also be a valuable tool for equity investors. For instance, Graham Secker applied Altman’s Z-Score to European stocks finding that companies in the red zone (Z-Score below 1) underperformed the wider market by more than 5-6% per annum with more than 70% accuracy for the period 1990-2008.
Enter the accrual effect: The Sloan Ratio.
Although not a scoring model in itself, the Sloan ratio introduced in 1996 by R.G Sloan was a useful tool for analysts to identify and rank stocks based on the sound theoretical reasoning that accrual and cash accounting divergences must eventually converge. This ratio has also played an important role in other fundamental scoring models to be discussed in the next sections.
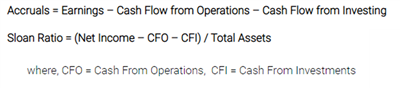
Source: Sloan Ratio 1996. Author Formatting.
Sloan’s main conclusion is that earnings driven by accruals are less persistent than those low accruals. In this way, the author demonstrates that a long/short portfolio (long low accrual and short high accrual stocks) was able to yield +10.4% CAGR (Compounded Annual Growth Rate) with statistically significant alpha and a 78.9% hit ratio for the period 1962-1991. Practitioners normally use Sloan ratio values between -10% and 10% to classify a stock within the “safe zone”; whereas values above +25% or below -25% are considered to be present in “bad accounting” stocks, especially when these metrics are consistent over several quarters or even years.
Other authors started working at the turn of the century in improving Sloan’s work. Hong Xie (2001) proves that the discretionary component of accruals is less persistent than the normal component so we can get a better measure eliminating accruals that appear to be economically justified. Particularly, Xie replicates the long/short portfolio analysis of Sloan showcasing a significant high-single-digit annual return spread between discretional vs non-discretional accrual portfolios. Similarly, Hirshleifer, Hou, Teoh, and Zhang (2004) improve the Sloan metric incorporating past year accruals, and two years as an ideal time span to accumulate accrual metrics, for the period 1964-2002 finding that net operating assets scaled by beginning total assets is a strong negative predictor of long-run stock returns.
The advent of the quantamental era.
The turn of the century witnessed an incredible body of research focused on finding a silver bullet scoring model to measure systematically either the accounting quality of a company or the probability of a particular stock to outperform (underperform). Fundamentally-based scoring models such as Beneish’s M-Score or Piotroski’s F-Score allow both fundamental and quantitative analysts to obtain a quick measurement to rank stocks.
Focus on Accounting Quality Models
In 1999 M. D. Beneish introduced the M-score providing financial analysts with an easy and quick way to spot the probability of earnings manipulation of a stock. The picture below displays Beneish’s M-Score trained model coefficients with an output that can be converted into a probability of financial statements manipulation. This model was trained with US public equities data from 1982 to 1988 and tested out-of-sample for the period 1989-1992. Although the time period of the sample only covers a decade, Beneish controls for industry effect and oversamples the true proportion of earnings manipulators to avoid turning the exercise into a forced balanced classification problem. However, the model is once again recommended to be used exclusively for manufacturing stocks.
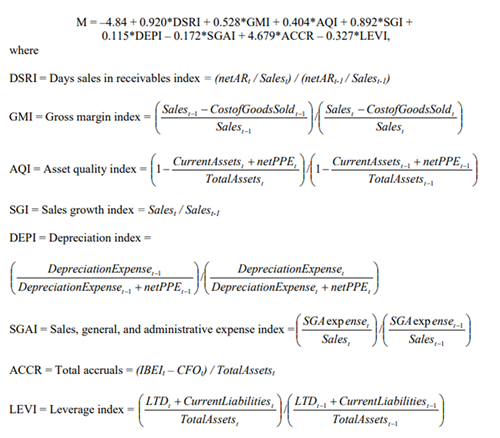
Source: Beneish1999. Author Formatting.
Beneish’s M-Score results were very relevant at the time with an accuracy of 76% and a false alarm (Type I error) of 17.5%. However, the performance of the model can vary significantly depending on the M-Score threshold value used, for which reason Beneish recommended a value of –1.89 to balance both the probability of missing a fraud (Type II error) and the probability of false alarm (Type I error). Subsequent research papers by Beneish and associates in 2013 found that companies with a higher probability of manipulation, as measured by M-score, delivered statistically significant lower returns of slightly below 1% per month on a risk-adjusted basis surviving size, value, momentum, accruals, and short interest risk premia effects.
Dechow, Ge, Larson, Sloan (2011) continued the work of Beneish’s M-Score focusing on bad accounting identifiers. Dechow’s F-Score (Fraud Score) main differentiating factor is that covers exclusively a sample that includes firms accused of earnings manipulation by the SEC from 1982 to 2005 using seven fundamental indicators that evaluate firms in five key areas: accrual quality, financial performance, non-financial measures, off-balance-sheet activities and market-based measures. Two significant differences of the F-Score compared to M-Score are that, firstly, the former model does not control for industry or size effect; and, secondly, Dechow’s F-Score study spans a longer period. That said, Dechow’s F-Score suffers from a high false positive rate (Type Error I) and the model can spot only misstatements that were actually identified by the SEC overlooking those misstatements not prosecuted by the US regulator.
The regulator effort: SEC Account Quality Model.
AQM (Accounting Quality Model) is the SEC’s effort to embrace data science and machine learning to identify accounting fraud. The fact that SEC standards require companies to file financial data using XBRL (Extensible Business Reporting Language) enables AQM to process data more efficiently.
AQM is designed to detect whether a company’s financial disclosures differ greatly from its industry peers. AQM issuance of any red flag automatically activates the need for additional scrutiny. The SEC model focuses on discretionary accruals as a measure of management discretion subdividing them into two groups: (i) direct factors that indicate earnings management (e.g. company accounting policies encouraging off-balance sheet transactions); and (ii) indirect factors that induce earnings management (e.g. company losing market share against peers). The US regulatory body claims that this approach is designed to minimise false positives. Moreover, NLP (Natural Language Processing) has been playing a bigger role over the last five years within the efforts of the SEC to tackle more efficiently accounting fraud.
Beyond bad accounting: Enter systematic fundamental investing
Earlier mentioned models have been mainly designed to either identify bankruptcy events or companies with a high probability of financial shenanigans. Nevertheless, the early days of the 21st century turned out to be the first steps of systematic fundamental investing with researchers such as Joseph Piotroski or Partha Mohanram leading the charge.
One of the most widespread scoring models was the F-Score (different from Dechow’s F-Score) popularized by Piotroski in 2000. Contrary to the previous scoring models, Piotroski’s F-Score main purpose is to deliver a single metric to allow investors to adopt a systematic approach to fundamental value investing. The next figure displays how the F-Score is calculated as the sum of the individual binary signals (1 indicates strength and 0 flags weakness) of 9 different fundamental indicators that cover a wide array of multiple company dimensions i.e. profitability (4 variables), liquidity (3), and operating efficiency (2).
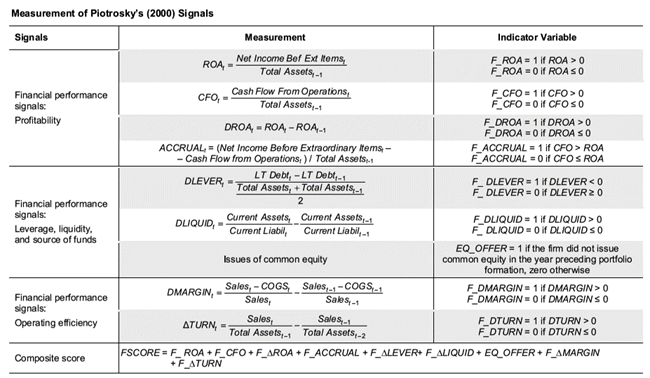
Source: Piotroski 2000.
The author expects this score to be positively associated with future firm performance and stock returns, and to test his null hypothesis creates two portfolios: a long portfolio with candidates showing F-Scores of 8 or 9, and a short portfolio with those with a poor score of 1 or 2. As a result, the long/short strategy delivered a significant 23.5% CAGR for American stocks for the period 1976-1996 delivering an additional +7.5% per annum over a simple value strategy based on the traditional Price-to-Book. Other authors have provided positive results when applying F-Score internationally such as Galdi and Lopes (2009) in Brazil (+26.7% CAGR) or Noma (2010) in Japan (+17.6% CAGR).
Piotroski’s model has been fiercely criticized on the back of multiple reasons. Firstly, the author recognizes that the selection of the ratios does not follow any robust methodology, which makes it prone to suffer from selection and human behavioural biases. Secondly, F-Score seems to be to improving a simple value strategy, yet it delivers negative alpha when other risk premia is taking into consideration (size, quality, momentum, etc). In other words, F-Score might be a reliable tool to improve value-driven investor results as proven by Piotroski and So (2012) or Edmund Ng (2009), yet it fails to produce statistically significant positive alpha and it’s exposed to a distribution of returns with fat tails and significant drawdowns only compatible with very long term investors with patience and no career risk. Another pitfall of the model is its naïve binary design completely disregarding more robust machine learning models that could factor more nuances in the relationship between the model features and the dependent variable. Other weaknesses of the model will be covered in more detail in future articles of this series.
Piotroski’s model inherently favours an investment style with a clear value tilt, which drove Mohanram to develop his G-Score in 2005 with the objective of finding a systematic way of investing in growth stocks. Mohanram’s G-Score is based on a combination of traditional fundamental metrics suitable for growth firms e.g. stability of earnings, metrics growth and the intensity of R&D, capital expenditure and advertising. As the figure below demonstrates, a novelty of Mohanram’s approach is to consider not only fundamental indicators on an absolute basis but also introducing a relative comparison to industry peers.
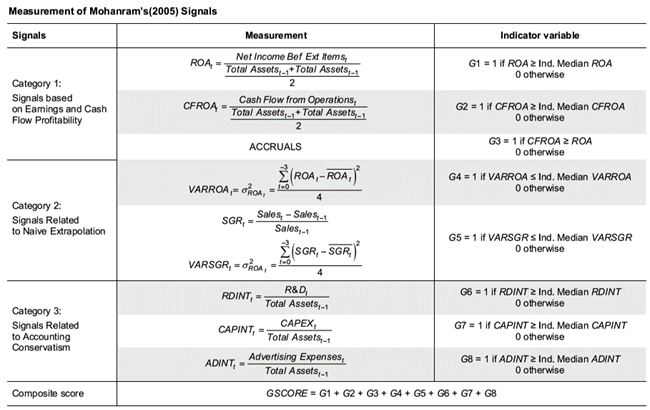
Source: Mohanram 2005. Author Formatting.
The author constructs a long/short strategy using his G-Score as key discriminator. The results delivered significant double-digit excess returns and statistically significant alpha after controlling for well-researched risk factors such as momentum, value, accruals risk and size. Moreover, the G-Score strategy was able to yield positive returns in 21 years out of 23 years backtested tantamount to a hit ratio above 91%.
Despite their many weaknesses and newly developed scoring models challenging their dominance flourishing over the last two decades, both Piotroski’s F-Score and Mohanram’s G-Score have not been ditched by investors. A recently published study by Amor-Tapia and Tascon in 2016 tests multiple scoring models using four different European stock markets. Surprisingly, Mohanram’s G-Score and Piotroski’s F-Score were the only ones surviving an out-of-sample backtesting delivering statistically significant alpha despite the other rejected models being developed at a later date.
Quantamental analysis: The dawn of the ML era.
The aforementioned scoring models have been recently panned over the last decade due to multiple reasons i.e. small sample properties, selection bias, data mining/snooping errors, poor model robustness, faulty indicators design, lack of usage of more advanced ML techniques, and lack of out-of-sample verification.
Moreover, McLean and Pontiff research on the “alpha decay” effect in 2016 was an eye-opener finding out that portfolio returns are 26% lower out-of-sample and 58% lower post-publication of a recently discovered alpha signal. In other words, the empirical evidence suggests that the new generation of researchers needs to be more creative and disciplined when developing new scoring models in order to minimize the generalization error, while applying more advanced ML-powered models that can create strong and durable IP (Intellectual Property) that is more difficult to replicate by peers.
A good and simple illustration of how to enhance some of the previously covered models can be found in the research paper authored by Balachandran, Saraph and Erjie Ang (2013). The authors main objective is to provide evidence that even simple ML techniques (Linear Regression, Logistic Classification and SVM) can be used to enhance the results of a Piotroski’s F-Score long-only strategy using US stocks data for the period 1977-2010.
The authors use two sets of features for training the models: the first set contains only real-valued (non-binarized) versions of the nine F-score variables; whereas the second set of features are expanded to include additional fundamental variables. The training of the model implements a two-year rolling window to predict next year returns; notwithstanding, the authors also display results using other three rolling windows: one, three and four years.
It is important to highlight that next year stock returns is the dependent variable of the Linear Regression model, yet both the Logistic Classification and the SVM models use a binary dependent variable with a value of 1 assigned to observation for a firm if the actual returns of that firm are in the top decile of the actual returns of all firms; otherwise, the observation’s class is coded as 0. The predictions of the latter two models are probabilities of whether or not a specific observation belongs to the top-decile class. As a result, the portfolio for the test year is then formed by selecting the top decile of the stocks according to their predicted probabilities.
A summary of the results is showcased in the next table. Overall, ML-powered strategies seem to experience a higher mean return profile than the vanilla F-score strategy (baseline) at the expense of exhibiting higher standard deviations. That said, the majority of ML strategies (87.5%) deliver a significantly higher Sharpe ratio than the standard F-Score strategy. SVM models seem to be particularly outstanding in terms of both risk and risk-adjusted returns.
Finally, there does not seem to be any value added from using additional variables to the original F-Score components, yet the authors do not provide additional information about these extra variables or the criteria used for their selection.
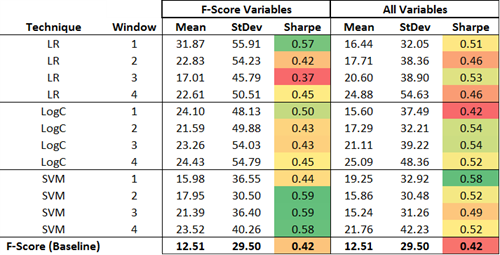
Source: Balachandran, Saraph and Erjie Ang (2013). Author Formatting.
This was an introductory and simple example about how to use ML to enhance one of the fundamental scoring models covered in this article. The body of research using new ML techniques has grown dramatically over the last five years and future articles will cover individually the different scoring models discussed here and the many evolutionary ML extensions published by several authors.
Conclusion: Where do human beings fit in?
ML-powered fundamental scoring models are the future and investment analysts should simply adapt and evolve along with them.
The penetration of data science techniques and machine learning methods in the workflow of the average human investment analyst is still in its early infancy. As more graduate students join the workforce within the next decade, the skill-set available in the finance industry is inevitable evolving towards an analytical profile that blends the contemporary abilities of both investment analysts and data scientists.
Personally speaking, I can’t help about the gains in productivity with an example of my own workflow. More than a decade ago, I was intensively maintaining and using a stock scoring model built exclusively in Excel/VBA with an average recalibration time of approximately two hours. As the number of data factors used grew, the model became a time-consuming, inefficient, and unreliable tool. The adoption of Python and SQL allowed me to minimize the business risk of the investment process and speed up 10x the regular workflow update time.
Although data science and machine learning techniques are here to stay, one should not underestimate the role of the human investment analyst within an investment process. At the time of this article, there are still many sources of information where machines are not yet competitive enough e.g. supply chain qualitative analysis, unstructured data interpretation lacking a reliable dataset, detection of nearby structural challenges; among many others.
Human investment analysts can still play a significant role when designing features for a ML-model as their fundamental understanding of the problem can allow ML engineers to build better models than relying on vanilla fundamental indicators without any kind of sound rationale. Moreover, machines can be very good at detecting persistent anomalies but they are still subpar at spotting “exceptions to the rule” or inflection points, which is where human beings can make a difference until the arrival of new ML and AI breakthroughs.
Future articles will focus on specific topics like the scoring models aforementioned, and the way we can enhance an investment process by building bridges between traditional fundamental investment and the unstoppable advance of ML and AI.

Carlos Salas Najera, University of London, Lead of the CFA UK Data Science Working Group.