Embracing machine learning to tackle portfolio optimisers limitations

Author: Carlos Salas Najera, CFA
Carlos Salas Najera, CFA, from the CFA UK Data Science Working Group, looks at Modern Portfolio Theory (MPT) in the second half of the 20th century up to the recent innovations of using Machine Learning techniques nowadays.
The content of this piece will be concerned with the mathematical limitations of the early theories and will leave aside other topics related to portfolio optimisation such as the factoring of behavioural biases, portfolio optimisation criteria (by style, country, industry, etc), or the purpose of the optimisation (asset allocation, ALM, long-short portfolios, etc). Furthermore, this article does not intend to cover all the body of research but only to emphasize those models that either propose a brand new approach, or have been broadly adopted by the industry over the last decade.
Portfolio Optimization: History in a Nutshell
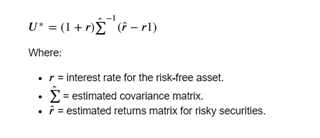
Markowitz’s MVO (Mean-Variance Optimisation) (1952) was the precursor of MPT spearheading the introduction of a more quantitative approach in the fifties to optimise portfolio allocations in order to attain proper diversification levels. Mathematically speaking, the MVO model can be expressed in terms of linear algebra as an unconstrainted optimisation problem:
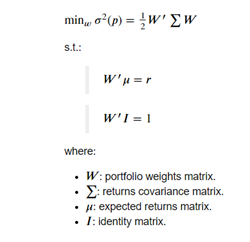
Factoring equality constraints into the objective equation is straightforward using Lagrange multipliers method:

Please note that “unconstrained” in this context refers to the existence of equality constraints only. A wide adoption of the MVO model by the investment community took more than two decades and, contrary to Markowitz’s recommendation, it was not implemented as an unconstrained optimisation problem but as a constrained one (no short-selling, security weighting limits, etc), for which reason authors like Richard O.Michaud (1989) pointed out that investment practitioners hardly could implement MVO in practice due to their unintuitive nature, investors goals differing from the MVO solution, and inferior performance to other more simplistic approaches like equally-weighting portfolios on the back of MVO’s model maximization of errors on the input assumptions.
As a result of this critique, new MPT approaches surged in the nineties such as Black and Litterman (BLM) (1992) tackling one of the key pitfalls of MVO by using an approach that reflects the preferences of investors. In this way, the BL model allows investors to factor relative and absolute performance views of the portfolio securities. Although the BL model is able to correct the dependency of prior MPT models using past returns, the approach hinges on the accuracy of the investor views and it is still exposed to the same numerical limitations as the original MVO.
An aggressive stand against MVO and MPT
With the advent of the 21st century, the investment research community adopted an aggressive stand against MVO and MPT-related models with research papers like the one released by DeMiguel, Garlappi, and Uppal (DGU, 2009) highlighting the consistently superior results of the simple equally-weighted approach compared to fourteen other MPT models. Coming at the rescue of MPT were Allen, Lizieri, Satchell (ALS, 2019) arguing that DGU results were spurious. ALS budget constraints, transaction costs and out-of-sample testing defend that MPT should be favoured by investors with forecasting skill, whereas those without skill are better off using an equally-weighted approach. Moreover, ALS also refute the affirmation by DGU regarding the large data required to properly implement MPT claiming that MVO is also superior when using short time frames to measure the variance covariance matrix. Last but not least, ALS do emphasize that prior research use of monthly data to estimate the covariance matrix is ill-advised and behind the poor performance of MPT models against the equally-weighted and passive approaches. The authors recommend more granular approaches to estimate the covariance matrix using dimension reduction techniques and a higher data frequency.
The ultimate mantra followed by the investment community has been that returns are more difficult to forecast than volatilities due to the well-researched volatility clustering effect. The main idea behind volatility models such as ARCH or GARCH is that volatility is a persistent moment highly dependent upon past realizations of the asset process. As a result, risk-driven portfolio optimisation models like Risk Parity (RP), based on implementing a portfolio weighting mechanism inversely related to the variance of the security returns, has gained industry acceptance as a simple but effective alternative to MPT models, especially after their success during the GFC in the period 2007-2010, and when used along factor returns as inputs for the decomposition of a portfolio’s risk profile. That said, RP is not immune to criticism as it is prone to overweight bond securities - which has proven to be a hindrance during disordered periods of higher interest rates like 2013’s taper tantrum sell-off – and it suffers from the same mathematical limitations that other MPT models as it will be unveiled in the next sections.
Lost in Oblivion: The Kelly Criterion.
Kelly (1956) introduced formally a criterion that was well-known in the gambling world but that was only introduced in the investments industry by the turn of the last century. Kelly’s approach is based on reinvesting in winners while implementing a large number of bets tapping into the law of large numbers; which is tantamount to the maximization of the logarithmic utility in the portfolio management world. Kelly’s criterion also presents drawbacks such as its excessive weight concentration on few securities, or its original univariate proposition suffering from mental accounting bias.
A number of Kelly criterion enhanced models have been released troubleshooting some of these limitations. For instance, fractional Kelly – betting a fixed fraction of the original amount recommended – has been proposed in order to force some diversification into the Kelly approach to protect portfolios from stochastic events not discounted by the deterministic Kelly solution. Moreover, new Kelly models have been proposed with a more holistic approach proposed to account for the aforementioned mental accounting bias by proposing a multivariate version with many stocks (bets) whereby the problem is transformed into a familiar unconstrained quadratic programming expression that can be maximized:
As the reader could expected, this multivariate Kelly equation will still be exposed to the same problems of our MVO optimisation problem due to the resurgence of two parameters to be estimated: risky returns and covariance matrix. Thorpe (2008) implements a Kelly criterion to investments in a multiple assets context using an approximation of the expected value of logarithm of wealth based on first and second moments. Nekrasov (2014) reconfigures the problem as a constrained one whose solution can only be found numerically and with an intensive amount of computation power despite the test being only conducted with seven German stocks. Both models still suffer from an excessive concentration of risks in few securities. Bottom line, scholar and practitioner research with regards Kelly criterion seems to be facing similar stumbling blocks as MVO in its multivariate version.
MPT Models: Mathematical Limitations.
Whether or not MVO and other MPT-related derivative models are able to outperform or underperform simple equally-weighted or passive portfolio allocation is a sterile debate; especially as we are aware that MVO itself is not flawless and can be enhanced as the next list of MVO shortcomings showcases:
- Overfitting and Backward Looking bias: mean-variance efficient frontier is estimated with past data tantamount to backward-looking bias. Hence, it is expected that they will underperform “out-of-sample”. As mentioned before, several methods like BL tried to tackle this criticism incorporating forecasts. In addition, recent developments in the research space are encouraging the use of out-of-sample, cross-validation as well as MonteCarlo simulations in order to provide a more robust set of acid tests.
- Big Data Requirement: Among the mathematical limitations of MVO are the requirement to work with a large amount of data to ensure the covariance matrix is factoring as many economic cycles and securities as possible. As highlighted in the previous section, there is an open debate about whether this is a problem of measurement i.e. increasing frequency granularity improves MVO covariance estimate according to ALS. Moreover, advanced in computing power and the advent of Quantum Computing Machine Learning may leave behind the setbacks of these big data requirement.
- Covariance Matrix Instability: the underlying unrealistic assumption that correlation between securities and asset classes is stationary throughout time is clearly flawed according to empirical observation.
- Real World Acid Test: albeit not a mathematical limitation per se, MVO and other MPT models are ideally designed as unconstrained problems that, eventually, failed to live to the expectations of practitioners as the latter are forced to apply real world constraints in order to reflect their investing preferences. Hence, a closed-form analytical solution is no longer feasible, and numerical approximations enter into the picture with most of the times practitioners using the wrong algorithm to solve the problem e.g. gradient-based algorithms depending on seed conditions that are prone to get stuck at a local minimum solution.
- Markowitz’s Curse: MVO optimisation demands the inversion of a positive-definite covariance matrix. Mathematically it has been proved that the higher the diversification, the more unstable the covariance inverse matrix becomes and, as a result, the less robust is the estimation of optimal weights. This weakness is also known as Markowitz’s curse.
The last limitation probably is the most important of the MVO model. As will be showcased in the next section, MVO covariance matrix inversion implies that all the securities are perfect substitutes of each other. In other words, quadratic optimisers assume that every security/node in the network is connected and, as a consequence, small estimation errors are propagated more significantly across all the optimal weights resulting in a covariance matrix estimate with low robustness and high instability.
Tackling MVO Limitations in the 21st Century: Embracing Machine Learning.
A quote by philosopher George Santayana worth remembering is “Those who cannot remember the past are condemned to repeat it”. In our first section MVO was introduced originally as an unconstrained problem by Markowitz. Nevertheless, we also saw that the investments industry mandate to reflect investor preferences into portfolios turned MVO adoption into a constrained portfolio optimisation problem. In fact, an investment practitioner is exposed to solve a portfolio optimisation problem facing equality (target returns, fully invested portfolio requirement), and inequality conditions (maximum and minimum bounds per security), for which there’s no an analytical closed-form solution and, therefore, a numerical solutions must be found using an optimisation engine and different techniques. Bailey and De Prado (2016) identify the next weaknesses when dealing with traditional optimisation techniques that can be found in commercially-licensed products, or open source libraries like Python’s Scipy library:
- Broyden-Fletcher-Goldfarb-Shanno method (BFGS): gradient-based method with seed vector dependency (i.e. algorithm given starting point), sensitive to boundary constraints, and risk of founding local instead of global minimum.
- Truncated-Newton method (TNC): gradient-based method with seed vector dependency, sensitive to boundary constraints, and risk of founding local instead of global minimum.
- Constrained Optimisation by Linear Approximation method (COBYLA): extremely inefficient in quadratic problems, and is prone to deliver a solution outside the feasibility region defined by the constraints.
- Sequential Least Squares Programming method (SLSQP): most of the times reaches a local minimum instead of a global minimum due to its seed dependency.
- Non-Negative Least Squares solver (NNLS): not able to cope with inequality constraints.
The authors recommend an already existent method called Critical Line Algorithm (CLA) created by Markowitz (1956), especially aimed at solving a constrained optimisation problem and ensuring the exact solution is found after an iterative process is implemented. Regardless, CLA is only a meaningful improvement to the available zoo of optimisation algorithms available that still suffers from the earlier mentioned mathematical limitations of MVO, being the covariance matrix estimation probably the most important of them.
Innovations
The application of Machine Learning techniques to investment problems has resulted on innovations in the topic of portfolio optimisation. In this way, unsupervised Machine Learning algorithms like PCA (Principal Component Analysis) has been used more intensively over the last decade by some authors to enhance the estimation of the MVO covariance matrix. Tan (2012) finds that MVO using an estimated covariance matrix using PCA improves portfolio efficiency (Information Ratio), improves weight stability and reduces transaction costs. Menchero, Wang and Orr (2018) observed that sample covariance matrices (historical returns) underestimate risks that can be captured by PCA. Hence, the authors approach used the more stationary information obtained from PCA-generated “eigenportfolios” to adjust covariance matrix estimates and obtained “out-of-sample” gains in the portfolio optimisation process.
Recently, Pedersen, Babu and Levine (2021) apply an optimised shrinkage factor to the covariance matrix estimate and expected returns that deliver gains in terms of model robustness as well as performance with better results than an equally-weighted approach and the passive portfolio (market portfolio), particularly improving risk-adjusted return metrics such as Sharpe ratio. The authors state that their EPO solution is tantamount to other MPT approaches under different conditions and values of their shrinkage factor, and tantamount to apply a popular supervised Machine Learning (ML) algorithm, Ridge Regression, of the expected returns on the covariance matrix.
The former ML methods are basically another way to adjust or shrink the historical covariance matrix to filter out noise and enhance weights stability, as Ledoit and Wolf (2003) proposed almost two decades ago. However, shrinkage methods result in a signal-noise trade off: shrinking trims down the noise, but weakens the signal. Lopez de Prado (2016) points out that shrinkage methods do not discriminate between eigenvectors associated with noise and eigenvectors associated with signal. As a solution, Lopez de Prado (2019) proposes a Nested Clustered Optimisation model that uses graph theory and an unsupervised machine learning algorithm like clustering to control for the noise-signal trade off, achieve gains in the stability of the solution, and attained superior “out-of-sample” portfolio allocations. In other words, HRP allows to factor a hierarchical structure into the estimate of the covariance matrix that breaks the earlier mentioned “perfect network” assumption underlying the original problem and, as a result, improves significantly the reliability of the covariance matrix estimated.
Hierarchical Risk Parity (HPR) models
Similar derivations of this hierarchical clustering approach have been tested by authors such as Lohre, Rother, and Schafer (2020) creating a new family of portfolio optimisation models christened as Hierarchical Risk Parity (HRP) models. Jansen (2020) describes in his book in few steps how the logic of a HRP models works:
- Define a distance metric and apply single-linkage clustering to identify hierarchical relationships.
- Use the hierarchical correlation structure to quasi-diagonalizable the covariance matrix.
- Apply top-down inverse-variance weighting using a recursive bisectional search that treats clustered assets as complements, rather than substitutes, in portfolio construction and reduces the number of degrees of freedom.
The reader probably is disappointed about the lack of solutions to tackle one of the main limitations of most of the earlier mentioned models: backward-looking bias. Lopez de Prado (2019) has also tackled this issue proposing a TIC (Theory-Implied Correlation) matrix approach based on fitting a tree graph structure to an empirical correlation matrix (e.g. historical) deploying hierarchical clustering. The tree graph structure allows investors to introduced qualitative fundamental information about the portfolio securities that can play a role in future covariance matrices with some examples show below:
- GICS industry classification.
- Economic Cycle Sensitivity i.e. Cyclical vs Defensive Stock.
- Shareholder ownership.
- Supply Chain Relationships.
- Thematic Exposures: Covid19 Exposed vs Stay-at-Home stocks, IoT exposure.
Therefore, investors using TIC are able to obtain covariance matrices that offer the best of numerical historical covariance matrices, and allow to factor multiple fundamental information that might kick in into price ultimately in the future. An illustration of this is Covid19: under normal circumstances the market is not pricing a premium to stocks with “stay-at-home” business models, yet were a new global pandemic to threaten mankind in the next two decade, this qualitative information will be priced again into stock prices.
Conclusion
MVO was an innovative approach to investments more than fifty years ago, albeit it was not without pitfalls. New machine learning techniques such as PCA, Clustering or Graph Theory have been able to tackle the main challenges proposed by the original MVO portfolio optimisation problem. The reader probably is missing some more detail about the application of ANN (Artificial Neural Networks) for portfolio optimisation problem, yet this will be a topic to be covered more thoroughly in future articles. In the meantime, a good place to start knowing more about ANN is the CFA Research Foundation book “Artificial Intelligence in Asset Management” released in 2020.
Bibliography:
- Markowitz, H.M. (1952): “Portfolio Selection”. Journal of Finance 7(1), pp. 77–91.
- Markowitz, H.M. (1956): “The Optimization of a Quadratic Function Subject to Linear Constraints”. Naval Research Logistics Quarterly, III, 111–133.
- Kelly, J. L. (1956). A new interpretation of information rate. Bell System, Technical Journal, pages 917–926.
- Thaler, R., (1985), Mental Accounting and Consumer Choice. Marketing Science, Vol 4., Summer 1985.
- Michaud, R.O., (1989): The Markowitz Optimization Enigma: Is 'Optimized' Optimal?, Financial Analysts Journal, 1989.
- Black, Fischer, and Robert Litterman. 1992. “Global Portfolio Optimization.” Financial Analysts Journal, vol. 48, no. 5 (September/October): 28–43.
- Thorp, E. (2008). The kelly criterion in blackjack, sports betting, and the stock market. Handbook of Asset and Liability Management 1.
- DeMiguel V., Garlappi L., Uppal, R. (2009): Optimal Versus Naive Diversification: How Inefficient is the 1/N Portfolio Strategy?, The Review of Financial Studies, Vol. 22, Issue 5, pp. 1915-1953, 2009.
- Allen D., Lizieri C., Satchell S. (2019): In Defence of Portfolio Optimisation What If We Can Forecast?, Third Quarter 2019 issue, Financial Analysts Journal.
- Qian, E. (2005): Risk Parity Portfolios: Efficient Portfolios Through True Diversification, Panagora AM, September Letter 2005.
- Roncalli, T., Weisang, G (2012). Risk Parity Portfolios with Risk Factors, Quantitative Finance, Vol 16, Issue 3.
- Tan, J. (2012). Principal Component Analysis and Portfolio Optimization. Pacific Life Insurance Company.
- Nekrasov, V. (2014). Kelly Criterion for Multivariate Portfolios: A Model-Free Approach. SSRN, 2014.
- Bailey, D.H, Lopez de Prado, M, (2016). An Open-Source Implementation of the Critical-Line Algorithm for Portfolio Optimization. Algorithms, 6(1), pp.169-196, 2013, Revised 2016.
- Lopez de Prado, M., Building Diversified Portfolios that Outperform Out-of-Sample. Journal of Portfolio Management. 2016. Summer 2016, 42 (4) 59-69.
- Menchero, J., Wang, J., Orr, D.J. (2018). Improving Risk Forecasts for Optimized Portfolios. Financial Analysts Journal V.68, 2012, Issue 3.
- Jansen, S. (2020). Machine Learning for Algorithmic Trading. Second Edition. Pack Publishing.
- Lopez de Prado, M (2019). Estimation of Theory-Implied Correlation Matrices. Cornell University - Operations Research & Industrial Engineering; True Positive Technologies.
- Lohre,H., Rother,C. , Schafer, K.A, (2020). Hierarchical Risk Parity: Accounting for Tail Dependencies in Multi-Asset Multi-Factor Allocations. Chapter 9 in: Machine Learning and Asset Management, Emmanuel Jurczenko (ed.), Iste and Wiley, 2020, pp. 332-368.
- Pedersen, L.H., Babu, A., Levine, A. (2021). Enhanced Portfolio Optimization. Financial Analysts Journal. V. 77.
 Carlos Salas Najera, CFA, Consultant, Portfolio Management and Machine Learning, and a member of CFA UK Data Science Working Group.
Related Articles